


India is one of the leading countries of the world in terms of solar power with a massive installed capacity of 35,122 MW at the end of June, 2020. The Government of India had initially targeted to achieve an installed capacity of 20 GW in solar power however this was fulfilled four years ahead of schedule.
The current target for India is to achieve 100 GW of solar power installed capacity by 2022. India also has the lowest capital costs per MW in the world. Keeping in mind the numerous advantages of solar energy, the Ministry of New and Renewable Energy has decided to incentivise solar power, making it more affordable to install solar power. While the prices of solar become more affordable by the day, it is important to understand the pricing of solar PV systems and how can these be reduced.
Different Measures of Cost
The cost of a commodity can be measured in different ways especially for something like electricity. The ways of measuring the cost of power generation differ in the things they consider to be a part of the cost. The different costs of power generation include:
The various ways of measuring the cost of power generation help analysing different factors. We shall see some of the costs mentioned above further in the article.
💡
For more such amazing content, do follow our LinkedIn page. 👇
Levelized Cost of Electricity Generation
The Levelised Cost of Electricity Generation (LCOE) represents the revenue (average) per unit of electricity generated which would be required in order to recover the costs of building and operating a power-generation plant for an assumed lifetime (US Department of Energy | Office of Indian Energy, n.d.).
In simpler terms, it measures the costs of a lifetime of a power-plant divided by the energy production. It is considered to be an essential indicator in the power generation field as it facilitates the making of a decision whether or not a project is feasible and economical. The LCOE is also a very effective indicator of comparison between the different power generation methodologies such as wind, solar, biomass and the others, as there are unequal capital costs, project spans, capacities etc. involved. The following image shows how the LCOE is calculated:
According to Wood Mackenzie, the LCOE in India using photovoltaics is the lowest in Asia Pacific with the cost being $38/MWh (~Rs. 2800) (India leads with lowest renewable cost in Asia Pacific, 2019). This cost is 14% cheaper than coal-fired power, which is traditionally supposed to be the least expensive form of power generation.
Solar PV Module Prices
With the increasing use of solar PV technology in India, there are various companies which manufacture PV modules and hence, the competitive market has seen the prices of solar panels decline over the years. Between 2014 and 2019, the average price of modules has reduced by a massive 31% (Solar PV Panel Market in India – 2019 – Power Insight, 2019). The prices of modules vary depending on whether the panels are monocrystalline, polycrystalline or made of other materials. The price of modules also generally decreases per kW as the total output Wattage of the modules increases. The efficiency of the PV modules also determines their price. The following are the different prices for PV modules in India depending on their efficiency, material and output:

Balance of System (BOS) Costs
Balance of System refers to all the components of a PV system other than the PV module(s) (Balance of System (BOS): what is it?, n.d.). These components include but are not limited to (How Much Does a Rooftop Solar PV System Cost?, n.d.):
A cost estimation done by Solar Mango shows the prices for the BOS components in Rupees per Watt and these are shown in the table below:
ComponentCost in Rupees/WattInverter6-12Cables1-2Mounts1.7-5Electrical Peripherals2Design and Installation4
Table: Prices of BOS Components in an On-Grid PV System
The above table lists a range of prices and these depend on the quality of the components being purchased. As can be noticed in the table above, there are no batteries mentioned. This is because the estimation is done only for a grid-connected PV system. Off-grid systems tend to be more expensive as the prices for batteries are quite high. Batteries not only have a high initial cost but also require maintenance and their replacement costs are again high. Hence, batteries add to the price of a PV system significantly. The prices for batteries are discussed below:
Battery Capacity (Ampere hours)Price (Rupees)20 Ah2,80040 Ah3,70060 Ah4,50075 Ah6,000100 Ah7,800150 Ah11,900200 Ah12,900
Total PV System Costs
According to the Economic Times, the price of grid-connected PV systems is in the range of Rs. 50,000 to Rs. 70,000 per kWP. The cost of on-grid systems varies with the inverter and module choice. The price for off-grid systems is approximately Rs. 1,00,000 per kWP. The price for off-grid systems is more expensive as compared to grid-connected systems because of the use of batteries which at present are high-priced. To install a rooftop solar system, it costs close to Rs. 1,00,000 per kWP including installation charges. If it is an off-grid system, it would cost around Rs. 25,000 extra. There are some incentives that the Government of India offers and these will be seen further down in the article.
Cost Reduction Potential for PV Systems
Over the years, the popularity of PV systems has increased globally, paving the pathway for the technology to become relatively more affordable. Technological advancements have reduced the price of PV modules and these prices are projected to decline even more in the coming future. Where module prices are projected to decline, the BOS prices are going to be essentially important as they would determine the total price of the PV system. And hence, over time BOS components also need to have reduced prices in order for the LCOE to stay reduced. According to the International Renewable Energy Agency, the BOS costs for a utility-scale PV plant can reduce by two-thirds (a range of 55-74% reduction) from 2015 to 2025 (Taylor, 2016). Considering an on-grid system, the prices of inverters are the highest out of all the BOS components. Research is being put into the reduction of inverter prices. A relatively new technology includes the use of micro-inverters built into the PV modules, eliminating the use of a separate inverter. AC modules are also being developed for the same purpose. The rest of the electrical components’ prices depend on the local region. India is one of the leading producers in the world of electrical components such as wires and switches, making the competition in the market quite high. The increased supply implies lessened prices of the electrical components. The mounting structures have also reduced in price over the last decade because of better designs and hence, the material used to make them being reduced. Finally, standardization and economies of scale will also contribute towards the mass-production of components and thus, towards the reduction of component prices.
💡
Did You Know? With ARKA 360, you can increase your solar sales conversion by a WHOPPING 300%. 🚀
Solar Benchmark Cost
The Ministry of New and Renewable Energy have released the benchmark cost of solar PV in India for the financial year 2020-21. The following table shows the benchmark cost in Rupees per Watt for the financial years 2019-20 and 2020-21 for comparison:

Before making an investment, it is common for any investor to wonder how long it will take for the product/service they are investing in, to start paying them back. It is the same case with anyone who wants to invest in a solar rooftop system or any other kind(s) of solar power systems. The time it takes for an initial investment to recover in the form of savings is called the Payback Period (What is the Payback Period of Rooftop Solar PV Systems?, n.d.). For instance, an investment of Rs. 50,000 is made in a rooftop solar PV system and it saves Rs. 5,000 every year on electricity bills. That means that the payback period is 10 years. However, it is not as straightforward since the payback period could differ depending on different factors which will be shown below. There are three steps to calculate the payback period for any rooftop solar system (What is the Payback Period of Rooftop Solar PV Systems?, n.d.):

Generally, the payback period is about 6-10 years (What is the Payback Period of Rooftop Solar PV Systems?, n.d.). Return on Investment or ROI refers to the return or revenue one generates as compared to the investment made on a particular product or service (What is the return on investment (ROI) and payback period of solar PV?, n.d.). For an investment such a solar PV system, the higher one’s monthly savings would be. This implies that the payback period will be lesser and hence, the ROI would be high. There are several tools online that calculate the ROI for solar PV rooftop systems depending upon the following factors:
Firstly, let us understand the business models that are available in the solar power market. In India, there are two business models that EPCs use (Business Models, n.d.):
1] CAPEX Model: CAPEX stands for ‘Capital Expenditure’, signifying that the capital expenditure is paid for by the owner of the solar rooftop. In this model, generally the consumer hires a solar EPC (stands for Engineering, Procurement and Construction) company to install the PV systems on their rooftop. Once installed, the EPC company hands over the system’s ownership to the customer(s). The CAPEX model allows owners of residential, industrial and commercial properties to also own a solar power system. In the case of an on-grid system, the excess electricity is supplied back to the grid. The following image depicts how the CAPEX model works for the different stakeholders involved:

2] RESCO Model: RESCO stands for ‘Renewable Energy Service Company’. A RESCO is a provider of renewable energy, usually in the form of solar power but also consists of wind energy and micro-hydro power. The RESCO model works in a ‘Pay-As-You-Go’ method, meaning that the customers only pay for the electricity that they consume. The PV system is owned, installed and maintained by the energy company. The consumer signs a contract with the energy provider company and has to pay a decided amount every month to the energy provider. Depending upon the requirement of the consumer and the consumption choice, the RESCO model is further divided into two types:
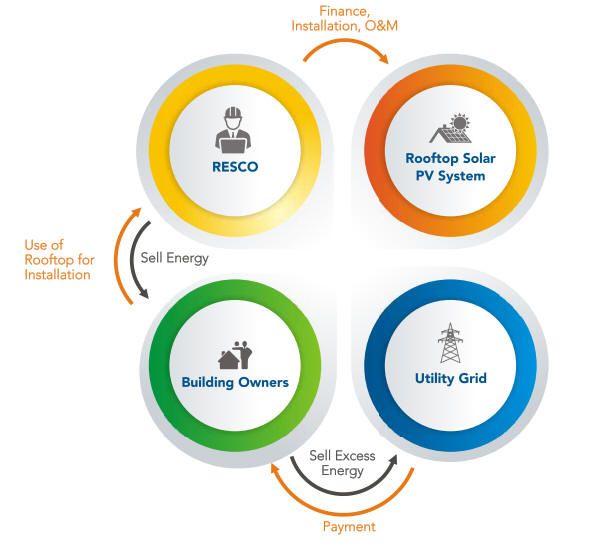
a) Power Purchase Agreement (PPA): A PPA works with net-metering. In a PPA, the energy company pays for a PV system to be deployed on a rooftop. The power generated from the rooftop is then sold to the owner of the building where the PV system is installed for a reduced price. The building owner can also sell the excess electricity that is generated to the utility. The following figure summarises how a PPA system works in the RESCO model:
b) Rooftop Leasing: This system works with gross-metering. In rooftop leasing, the energy company leases the rooftop for a specific period of time and pays the owner the lease/rent for installing a PV system on the roof. The power generated is sold to the utility for a pre-approved feed-in tariff. The following figure depicts how rooftop leasing system works in the RESCO model:

Now that we know the business models in place, it is essential to understand which model is for whom. We shall see in the next section the models and their suitability to the different needs of customers.
CUSTOMER SHOULD CHOOSE CAPEX IF…CUSTOMER SHOULD CHOOSE RESCO IF…They want a quicker ROI (about 3-5 years) and electricity for free for about 25-30 years after payback, orThey are comfortable with being in a long contract of about 15-20 years, orThey want to invest their money in solar in order to acquire better risk-adjusted returns than other financial or business assets to generate more over a 25-year period, orThey can regularly generate cash over their RESCO contract period, orThey want some indirect benefits such as accelerated depreciation, cheaper electricity etc.They do not want to invest in a project but still want cheaper electricity, or They are ready to handle any unsatisfactory services of the RESCO as there is no choice to switch between the services providers. Also, because of the contractual obligations and hassles involved, it is almost impossible to switch anyway. A RESCO will not accept such terms before they realize their returns.
The Ministry of New and Renewable Energy (MNRE) of the Government of India is incentivising the installation of PV systems because of the numerous advantages solar energy has. For the same, the MNRE offers a subsidy to the users. In residential, institutional and social buildings, a subsidy of up to 30% is offered for the installation of rooftop solar PV systems. On top of that, for rooftop solar system, 80% accelerated depreciation is offered to customers under the Income Tax Act. This makes the total price one pays for rooftop solar PV installation even lesser. Finally, the government also offers income tax credits which work in a similar way to the subsidy; instead of the capital cost of deploying a PV system decreasing, the amount is deducted from the customer’s income tax (How Much Does a Rooftop Solar PV System Cost?, n.d.).
The beginning of 2020 saw the rise and spread of the infamous COVID-19 virus. Indeed, the global pandemic has brought about a lot of change in the world and economies around the world have suffered severely as a result. This includes the solar industry too. At the end June 2020, India had an installed capacity of solar energy at a massive 35,122 MW. India has targeted to have a 100 GW solar installed capacity by the year 2022 but the pandemic has cost the country about 3 GW of solar projects worth Rs. 160 billion (Pimpalkhare, 2020). India imports about 80% of its PV modules and cells from China; the pandemic originating in China has also affected the imports earlier this year (Pimpalkhare, 2020). Although the trade has resumed, the prices are now more expensive than they were before the pandemic because of the global supply chain crisis (Pimpalkhare, 2020).

